


Part 2: Can Rolling Resistance & Rider Weight be Assumed Constant?
- Jan 27, 2018
- 6 min read
If you haven’t already done so, read Part 1 of this article focusing on estimating CdA and introducing the power balance for a cyclist in motion. The equation is provided here again for reference.
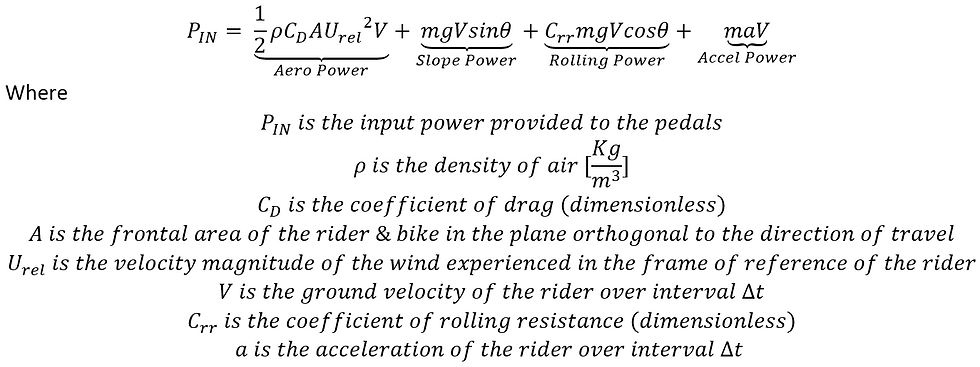
The take home message for anyone reading this article is as follows: When using Aerodynamic Sensors on a bicycle for the purpose of estimating CdA, the total weight of the rider must be known within about 0.5 [Kg] or better, the rolling resistance coefficient Crr should be either known or measured with significantly better than 10% accuracy, and calibration bias in power meter measurements should be significantly less than 2% of the measured power. Compounding of these errors with sensor measurement error will be discussed in a subsequent article.
What kind of CdA accuracy is needed? Well, a relatively low 3% error in CdA corresponds to approximately 50-70 grams of drag at 40 [kph] and amounts to roughly 3 minutes in time over the course of an Ironman distance (180km). Keep this in perspective when considering the use of aerodynamic sensor technology for field testing. While a verdict has not yet been reached on what level of accuracy is realistically achievable for an aero sensor, AeroLab Technology sensors currently resolve changes in the bicycle-rider system on the order of 40 grams (often even better than this, but there is a caveat here in that you must carefully control your testing conditions). This is as good or better than force measurement systems in many wind tunnel facilities (*accounting for errors associated to repeatability of a measurement in a wind tunnel is a big issue here*). It is the desire of AeroLab Technology to provide a sensor system capable of detecting relatively small changes in drag, as they can amount to significant changes in race day performance. Should you want to know about the details, please continue reading!

Based on the power balance equation stated in Part 1 and at the beginning of this article, the rider mass appears in the power of the road slope, rolling resistance, and acceleration. Let’s consider a scenario where you have a weigh scale, and just before a 4 hour long ride you weigh yourself with all equipment including your bicycle. You will lose weight while you ride - there have been plenty of 4 hour rides where I consume 1 L/hr and still lose about 0.5 [Kg] of body mass per hour. Keep this in consideration while we look at some real course data. The course data being used for this analysis is a 10 km loop in Calgary, AB, Canada, that has been used for AeroLab Tech prototype testing (see image below). The course has flat stretches, a few rolling hills, and one longer climb – overall a nice course for experimental testing.

The AeroLab Tech Simulator: Using the in-house developed AeroLab course simulator, a simulation of the ride can be generated using a time-marching scheme that is coupled with a uniform spatial discretization of the elevation vs position along the road direction. The primary inputs to the simulator are: Power Input, CdA, Crr, wind, Rider Weight, and environmental factors. As an example, the plot below shows wind data and ground velocity data (via GPS) obtained through one loop of the course. Also shown in the plot is ‘simulated’ ground speed. The ‘simulated’ ground speed is obtained by simulating the course via the inputs stated above. This looped course has four corners, the first three are identified with arrows in the plot below.
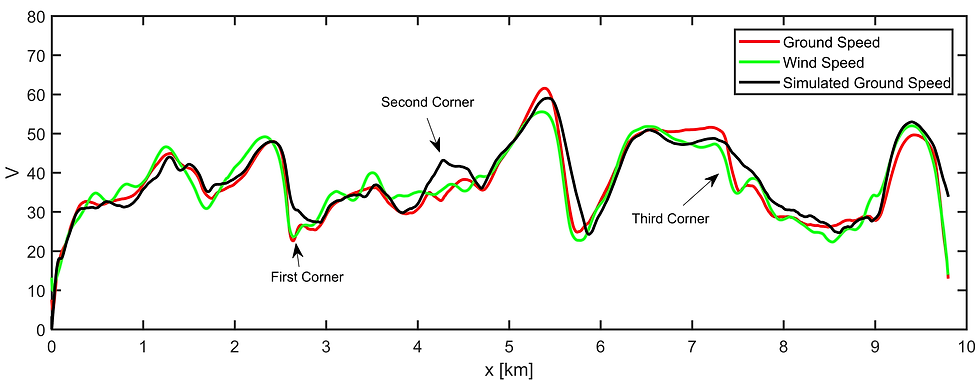
The simulation ride was generated based on a measured rider mass of m = 100 [kg], CdA = 0.330 (obtained using AeroLab Tech algorithms with a post-ride analysis using a combined Virtual Elevation (VE) and least squares regression approach), Crr = 0.0055 (obtained using VE method in combination with a least-squares regression approach), and Power Input matching that used by the rider at each location in the course (i.e., the simulator uses a power file, which results in much better agreement than than just a single power value that is assumed to be constant throughout the entire ride).

To identify the effect of mass bias on CdA estimation, we will first change the mass, then compute the finish time. Following this we will revert to the ‘correct’ mass value and see what equivalent CdA, referred to as (CdA)e, would give rise to the same finish time. The results of the first set of simulations are provided in the Table below. The first row of data shows Baseline 1E, which corresponds to the ‘simulated velocity’ plot shown earlier. The majority of the input parameters are shown, followed by the race time, the difference in race time from the baseline, the equivalent (CdA)e required to produce a race time that matches with the baseline, and the error in CdA associated to an incorrectly inputted rider mass.
The final column is an elevation metric, E*, which in my years of racing I have referred as course difficulty (anything above a 10.0 was considered ‘hilly’ for me in rural Ontario). E* = meters of ascent/kilometers of distance traveled [m/km]. To view how the course elevation profile alters the results, I have completed simulations where each elevation point is doubled without altering the distance traveled.
The results in the table show that for an uncertainty in the rider mass on the order of 0.5-2[Kg], this will introduce a CdA error of at least 0.2-2.9%, or 3-62 grams of drag at 40 [kph]. It is strongly recommended for any rider using AeroLab sensors to carefully measure their total weight prior to any aerodynamic road testing with a level of confidence of 0.5 [Kg] or better. In this way, a rider can attribute a measured change in CdA to an actual change in aerodynamic performance. Since errors can compound, we now should consider the uncertainty in Crr and its effect on CdA estimations.

The following Table summarizes the simulation results for changing Crr, and its potential effects on CdA estimation. The results indicate that a small change in the assumed value of Crr, say 0.005 vs 0.0055, gives rise to a potential 3% error in the estimation of CdA. This is comparable to the error in CdA from providing a rider weight that is off by 2 [Kg]. While it is relatively straightforward to measure your weight, Crr is a different story. Our recommendation is to let AeroLab sensor technology determine Crr. What the rider should do before each ride is ensure the tire pressure is consistent, the tire type and tube (where applicable) is consistent, and make sure that the wheels spin true. (Note: a brand new tire may produce a different Crr than a used tire. If your plan is to test your CdA with different equipment and different positions, stick with a tire that already has a few hundred kilometers of riding on it as the transient effects of Crr on tire wear will be diminishing).

For your own entertainment and enjoyment, instead of a constant value of Crr, I decided to add quasi-random noise. The random noise has zero mean and an RMS up to 30% of the baseline Crr. In all cases, this (perhaps not surprisingly) did not alter the finish time and would not alter estimations of CdA in an average sense (instantaneously it certainly would depend on the number of samples that are used in the real-time calculation of CdA). Now, for anyone still reading, you likely want to know what happens when we mess with power, and what happens when we mess with the wind. Firstly, if random noise with zero mean is added, this does not alter the finish time and would not impact an average CdA estimate. However, a bias error (something that a zeroing of the power meter ought to remove) does impact things quite a bit. I hope to get into more detail on this in another article since the location of the power measurement is critical. Since the present data were collected on a hub-based power meter, I simply ran the simulation using a constant offset of 2 [W], 5 [W], and 10 [W]. The results in the Table suggest that bias errors on the order of 2% of the measured power (in this case 5 [W]) result in an error of 3.3% in CdA.

I hope that this article has been informative. You may have questions about the results presented, the nature of the simulation, and how exactly the AeroLab Tech sensor estimates CdA and Crr in real-time. As we release additional blog articles on the technology, all will be revealed.
Comments