


Power Meter Data Quality & Real-Time CdA Measurements
- Mar 12, 2018
- 12 min read
What accuracy and precision in power meter measurements are acceptable for computing aerodynamic drag? This is the focus of the current article. If you have not already done so, please see our first two articles on Rider Weight and Rolling Resistance. Recommendations have been made for real-time aerodynamic testing. They are summarized here as follows:
1) You must weigh yourself + bike and any equipment being carried to within 0.5 [Kg] or better.
2) Do not try and guess at your Crr (Rolling Resistance Coefficent). A small error of 0.0005 in your Crr estimation throws off the CdA readings by at least 3%! Let AeroLab Sensors determine your Crr in real time for you.
In the article below, additional recommendations have been extracted for performing real-time CdA calculations:
3) If you have a hub-based power meter, lucky for you! Your hub system should be calibrated (zeroed) before each ride using manufacturers instructions, and you can expect the precision of your power measured over the course of a ride to be better than 0.5%. Your corresponding CdA measurement error introduced from the power meter variances from ride to ride is less than 0.6% for this level of precision. Hence, you can expect to potentially see 0.6% variability in CdA from ride to ride. The good news is that this error has a zero-mean value (long enough rides or enough trial runs using the same setup, this error source will tend to zero).

4) If you do not have a hub-based power meter, it is a bit more complicated. First of all, you must regularly clean and lubricate your drivetrain. You can expect the same level of precision in your power measurement (0.5% or better). Your CdA measurement variability from ride to ride will be higher (0.6% to 0.8%) for his level of precision due to the unknown variances in drivetrain losses throughout a ride. AeroLab sensors include an algorithm for modeling variation in drivetrain losses throughout a ride and this reduces the error. Similar to point 3) above, with long enough rides or enough trial runs using the same setup, much of this error source will tend toward zero.
5) If you do not have a hub-based power meter, expect your CdA accuracy to be within about 3-10% of the true value when drivetrain losses are not accounted for (the accuracy depends on just how efficient your drivetrain is and whether or not a drivetrain loss model is being included in the CdA estimation!). If you do account for drivetrain losses (as discussed below with AeroLab modeling), this accuracy can be improved significantly. Unfortunately, drivetrain losses will not have zero mean effect as they can be considered a form of systematic or bias error. It does not matter how many trial runs you have with the same equipment, there may be some unknown error in your CdA associated to drivetrain losses.
When selecting a power meter, consumers may have an expectation of ‘good’ precision and ‘good’ accuracy. To clarify, precision refers loosely to the repeatability of a measurement when conducted multiple times, while accuracy refers to how close the measurement is to some known ‘true’ value. The difficulty in measuring accuracy and precision with power meters is that an experimental setup must be devised to have a known ‘true’ value from which the measurements can be compared. In many online articles, you will see a comparison of power meters while riding. A good example of this is the review posted by DC Rainmaker on the 4iiii precision power meter (https://www.dcrainmaker.com/2015/12/4iiii-precision-review.html). In this review, four different power meters are compared: PowerTap P1 Pedals, PowerTap C1 Chainring, 4iiii Precision (left only), and PowerTap G3 Hub. A summary of one test ride of results showed an average power of 213 [W], 209 [W], 206 [W], and 215 [W], respectively. Clearly some differences in the measurements do exist, and in the worst-case scenario, we have a difference on the order of 5% between the 4iiii and the PowerTap G3 Hub. But what is the ‘true’ value of the power being utilized in forward motion down the road?

The fact is, we do not know. Most seem to adhere to the thought that a hub-based system would provide the closest possible measure when compared to the ‘true’ value since drivetrain losses do not need to be accounted for in the power measurement. This, however, assumes that all power meters are designed, built, and calibrated in the same way with the same rigor (more on this in a bit). Nevertheless, the DCR reviews on power meters are quite useful in getting an idea of the kinds of variability observed while a power meter is in operation. It also certainly builds confidence when you have a new entry to the power meter market matching up with other well-established brands. It is important to highlight that the results in the DCR post may seem alarming. In the last article we posted, a 2% offset in power values led to a 3% change in CdA estimation. We ideally want precision in CdA estimates on that order or better.
Here is the good news: if you use a consistent power meter (e.g., always use PowerTap P1 pedals, or always use a pair of Garmin vector pedals) the results from this power measurement ought to be consistent and thus can be used to investigate changes in aerodynamics. On the other hand, you will most certainly run into problems if you are changing between different power meters (as noted by the above differences in the DCR article). What does this mean for any user? Stick with one trustworthy power meter for all aerodynamic measurements. If you need to replace this power meter or switch to a different power meter, then you will need to complete a few test rides using a previously established equipment configuration (one in which your CdA has been well established) in order to determine a mapping between the old power meter and the new one.
First, let’s sketch out where these power meters are located on the bike and talk a little bit about my good friend friction! For an amazing review of 2017 power meters, check out DCR (https://www.dcrainmaker.com/2017/11/power-meters-annual-buyers-guide-2017-edition.html)
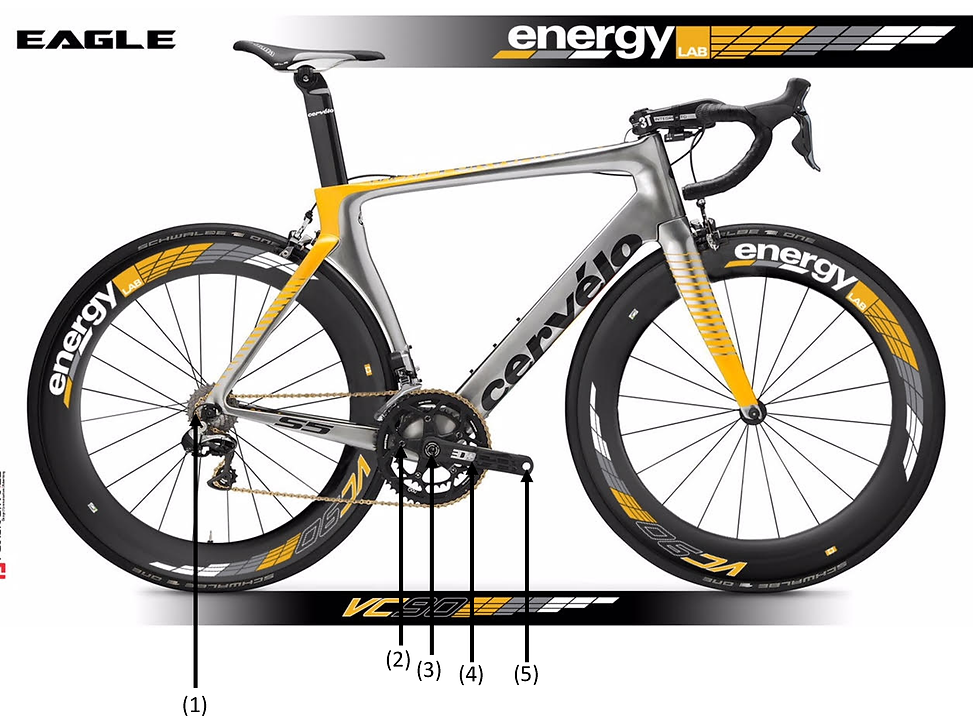
The image above shows five locations which are highlighted on the bike, and corresponds to locations where one might find a power meter. Oddly, I want to start with location (5) and go in reverse. The reason for this is that (5) is the pedals, and this is the origin of your input force (examples include the Garmin Vector and PowerTap P1 pedals). Moving to location (4) (examples include 4iiii, Stages, and Rotor), the input force you put into the pedals would be transmitted through the crank arm. I don’t want to talk about strain gauge design, but one can imagine that depending on the direction of the force vector you are applying to the pedals may alter how much you are actually deflecting the crank arm and would alter the force measurement at location (4). Ideally, you apply a force that is perfectly orthogonal to the crank arm. Moving to location (3), your bottom bracket/axle, the rider has transmitted forces through the crank and into the bottom bracket (examples include ROTOR INpower). Next (2) is where several top brands of power meters exist by employing power measurements within the crank spider and chainrings (e.g., quarq, Power2Max, SRM, and PowerTap C1). All power measurements up to this point can do a reasonable job if one is interested in the rider input power. If you want to know how much of that power you are applying is being transmitted to the wheels, the drivetrain efficiency must be known, along with any bearing losses encountered between the power measurement location
and the road. This leaves us with one last power measurement location (1): the rear wheel (e.g., PowerTap hubs). Location (1) is ideal from the standpoint that it provides the closest measure of the transmitted power to the wheels (i.e., the useful power that would be important from the perspective of aerodynamic calculations). As long as the bearings in your wheels are not in rough shape, the power meter measurement at the hub location can be used directly in computation of aerodynamic drag (CdA). On the other hand, power meter measurements at locations (2)-(5) can have some estimation of the drivetrain losses incorporated into the aerodynamic drag computation. Martin et al. (1998) utilized an estimated drivetrain efficiency factor that was assumed to be constant across any measured power. This efficiency factor is applied directly (multiplied) by the total measured power. Values of drivetrain efficiency can vary between 93-98% for modern bicycles (i.e., a typical road gear range and derailleur system).
Cycling Power Lab (http://www.cyclingpowerlab.com/drivetrainefficiency.aspx) has a nice summary of key points regarding drivetrain efficiency and indicates that they assume a drivetrain efficiency of 98% for their pro race power analysis suite.

The challenge to AeroLab Tech, is to determine an appropriate drivetrain loss model, and determine if the changes in your drivetrain efficiency over a ride, or over multiple rides will result in significant errors in aerodynamic calculations. Note, it has been well established by the great people at friction-facts (https://www.friction-facts.com/) that your choice of lubricants, chains, pulleys, bearings, etc., have significant impact on overall drivetrain efficiency. I have purchased, downloaded and extracted all quantitative information in the friction-facts reports. Based on this, I have been able to construct an empirical model of drivetrain losses that includes a fixed offset (power loss) plus additional power loss as a function of load (thank you friction-facts!). To include variability in the drivetrain losses throughout a ride and across multiple rides, I looked closely at the measurements by friction-facts concerning cyclocross race conditions in comparison with the CS3 active chain cleaning study in clean, rainy, and muddy conditions. The results have enabled some estimates to be made on how changes in your drivetrain efficiency will affect your estimated CdA. It is important to note, that this does not apply to any rider using a hub-based power meter.
To investigate the effects of different drivetrain loss models on aerodynamic calculations of CdA, we will use the AeroLab course simulator. The same ride data used in our first two articles will be employed yet again. This time, rather than applying a bias offset in the power measurement, we will apply a drivetrain efficiency model that includes load as well as environmental factors. In addition, with some insider information, we estimate the precision of any given power meter (repeated controlled test over a significant duration) to be within 0.5%. You may believe that 0.5% is an aggressive estimate of precision over a ride, but here is the reasoning: You apply a fixed known power of 200.0 [W] to your bicycle. Instantaneously, the power meter measures 202 [W], 200 [W], 198 [W], etc. On the average, the effects of precision error (over a large number of samples) average to zero (the assertion here is that power meters are precise, but not necessarily accurate). This effect is important when considering real-time CdA measurements, as the averaging interval will dictate the level of confidence one has in the CdA measurement. Ideally, the time-average value of the power in the reasoning above will be 200.0 [W], but this assumes there is no systematic (or bias) error associated with the calibration of the power meter or other sources such as drivetrain losses. If we assume that the power measurement occured on the crank arm, bottom bracket/axle, or pedals, then a model must be applied to determine the drivetrain efficiency, as well as its changes throughout the ride. For the purposes of demonstration, we assumed that the drivetrain efficiency changes linearly with distance traveled and apply a 10% change in drivetrain efficiency over the course of the ride (note, based on the data from friction-facts, a 10% change is quite large and significantly higher than that expected on a clean road ride).
The results from the simulations are shown in the Table below. For the power meter mounted at the hub, Baseline 1E shows a finish time of 16:25.0, with a CdA of 0.330. Applying an assumed precision error of 0.5% and 1% is shown in the next two rows of data (P01 and P02). The resulting error in CdA for these two cases is between 0.6% and 1.5%. For simulations P03 to P06, the precision error is set back to 0%, and we assume that the power
measurement is located on the crank arm, bottom bracket/axle, crank spider, or pedals. This means a drivetrain efficiency model is applied. For simulation P03 and P05, the efficiency is stated as 94% and 97%, respectively. As discussed earlier, the efficiency is a function of load applied, and there is also a fixed offset value. This means the efficiency is not a constant 94% or 97% as the table indicates. For AeroLab, when we specify 94% or 97%, this is the modeled efficiency at 250 [W] load. The results in the Table show a 94% drivetrain efficiency leads to a 9.7% change in the estimated CdA (simulation P03 in the Table). For 97% drivetrain efficiency, there is a 4.7% change in the estimated CdA (simulation P05 in the Table). These are some big errors in CdA, and they would primarily contribute to the CdA accuracy (CdA precision is not affected here). How do you know what your drivetrain efficiency is? In the power balance equation shown in our first article, you will see that the terms in the equation scale with the ground velocity of the rider. The good thing about drivetrain losses, is that a good portion of them can be modeled to scale with applied load. This leaves open the possibility of developing drivetrain loss models based on collected ride data. This is all I can say on the subject at this point.
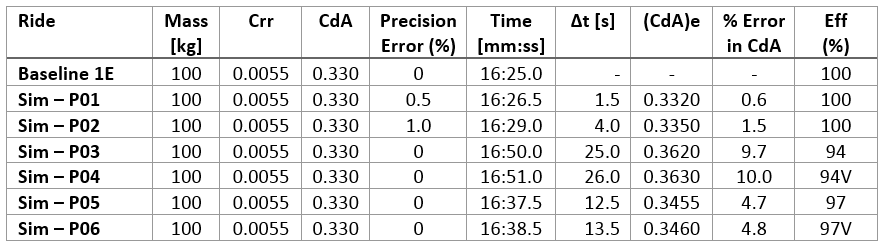
AeroLab has gone further and modeled changes in your baseline drivetrain efficiency during a ride owing to dust, debris, and general wear (simulations P04 and P06). A variable 94% starting drivetrain efficiency (denoted as 94V in the Table), results in a 10.0% change in the estimated CdA. The difference is 0.3% when comparing between P03 and P04. For a variable 97% drivetrain efficiency (denoted as 97V in the Table), there is a 4.8% change in the estimated CdA. The difference is 0.1% when comparing between P05 and P06. Hence, variability in your drivetrain efficiency throughout a ride accounts for less than 0.1-0.3% error in your CdA estimation. This is good news.
The take home message: Power meters located on the crank, crank-spider, pedals, etc., can be used to detect changes in aerodynamic performance. You must look after your drivetrain system (clean and lubricate often to ensure consistency in its operation). You will not be able to compare

your CdA data to wind tunnel results very easily, or CFD data. If you swap out drive system components, lubricants, etc., you may notice a change in CdA owing to changes in the drivetrain losses if the upgrade was significant. If you use a hub-based power meter for aerodynamic testing, then these issues are circumvented as the location of the power measurement is past the point of the drivetrain.
AeroLab sensors include a drivetrain loss model, developed based on our own controlled tests, as well as the data from friction-facts and other sources. The AeroLab drivetrain loss model improves the accuracy of your CdA measurement and does not significantly affect its precision. The degree of improvement in accuracy depends on how well the rider maintains his drivetrain system.
A note on power meter variability
It is worth citing and highlighting a recent publication by Maier et al. (2017). In this article, 54 power meters from 9 different manufacturers were calibrated and then tested using a specialized treadmill apparatus along with a weight and pulley system so that a mathematically derived ‘true’ power value could be obtained and used for direct comparison. They even included a drivetrain loss model obtained from a conversation with the folks at friction-facts (I personally think that the study should have attempted some more rigorous tests to experimentally determine the drivetrain loss for the bicycles tested). One of the main features of the study, was to show how much variation exists with multiple power meters from different manufacturers: did each measure the same power, and how far off was it from the ‘true’ value? The results showed that the average deviation from the true value (for all data from all 54 power meters) was about 5% to -7% with 95% confidence (if you happen to be reading the paper, they report lower values, but are only reporting 1 standard deviation. If you want 95% confidence, you need to adjust that value and assume the data is normally distributed). The data indicates quite a significant amount of variability, which supports my earlier recommendation that a new power meter purchase, even if it is from the same manufacturer, requires new baseline tests with an aero sensor to sort out the differences in your power measurement.

Can you compare your measurements on the road to that of a wind tunnel? The results in the Maier et al. (2017) study indicate it will be quite a challenge owing to power meter variability. That said, 20 years ago, Martin et al. (1998) did precisely this and had access to a “true value” of power from which a comparison could be made between the SRM measured power (for anyone interested, there was a 2.36% difference that was attributed to drivetrain losses). No regular consumer will have access to this type of information as it will depend on their drivetrain state and so my assessment here is that a consumer cannot expect a wind tunnel measured CdA to match *perfectly* with a field-based CdA unless the consumer has access to information on the “true value” of power input. If someone reports that they wind tunnel tested and found CdA = 0.2301, and then road tested with a power meter on their crank arm for example and obtained nearly the same value (say 0.2308), you can respond with one of two possibilities: (1) they are lying to you, or (2) they got lucky and place a bet that they can't repeat that measurement (for a definition of luck: power meter was perfectly calibrated in the factory, they are using a magical unicorn drivetrain with zero losses or they have modeled the losses to perfection, they tested in the same body position with the same equipment, they tested while pedaling in the wind tunnel as well as on the road, they accounted for the rotating spoke drag and associated angular momentum sink which is not captured in a wind tunnel measurement, they completed their test on a windless day so basically zero yaw and turbulence effects, and the bicycle-rider system CdA is perfectly invariant with Reynolds number). At AeroLab, we are developing a robust protocol that allows you to compare your wind-tunnel measurements to your road measurements, but this is for the extreme pointy-end of the field (those with the $$$$ to do wind tunnel testing). For us mere mortals, we evaluate CdA in the field and use this data to make important race day decisions.
References
Martin JC, Milliken DL, Cobb JE, McFadden KL, Coggan AR (1998) “Validation of a Mathematical Model for Road Cycling Power,” Journal of Applied Biomechanics 14, pp. 276-291.
Maier T, Schmid L, Muller B, Steiner T, Wehrlin JP (2017) “Accuracy of Cycling Power Meters against a Mathematical Model of Treadmill Cycling,” International Journal of Sports Medicine 38, pp. 456-461.
Comments